

- Bitcoin price declined again and tested the $3,550 support area before recovering against the US Dollar.
- There was a break above a major bearish trend line with resistance at $3,585 on the hourly chart of the BTC/USD pair (data feed from Kraken).
- The price is currently showing positive signs above the $3,600 support level, with a bullish angle.
Bitcoin price broke a key resistance near $3,600 recently against the US Dollar. The current price action is positive, signaling an upside extension above $3,700 in the near term.
Bitcoin Price Analysis
There was yet another rejection near the $3,660 resistance in bitcoin price against the US Dollar. The BTC/USD pair dipped below $3,600 and retested the key $3,550 support area. Buyers protected the $3,550 support and the price bounced back. It climbed above the $3,580 and $3,600 resistance levels, signaling a decent recovery. There was also a break above the 50% Fib retracement level of the recent decline from the $3,715 swing high to $3,549 low. More importantly, there was a close above $3,600 and the 100 hourly simple moving average.
Finally, there was a break above a major bearish trend line with resistance at $3,585 on the hourly chart of the BTC/USD pair. These all are positive signs above the $3,600 level and the 100 hourly SMA. However, the price seems to be facing a solid resistance near the $3,650-3,660 levels. It coincides with the 61.8% Fib retracement level of the recent decline from the $3,715 swing high to $3,549 low. Therefore, a proper close above the $3,660 resistance could clear the path for more gains above $3,700. The next main resistance is at $3,715 and $3,730.
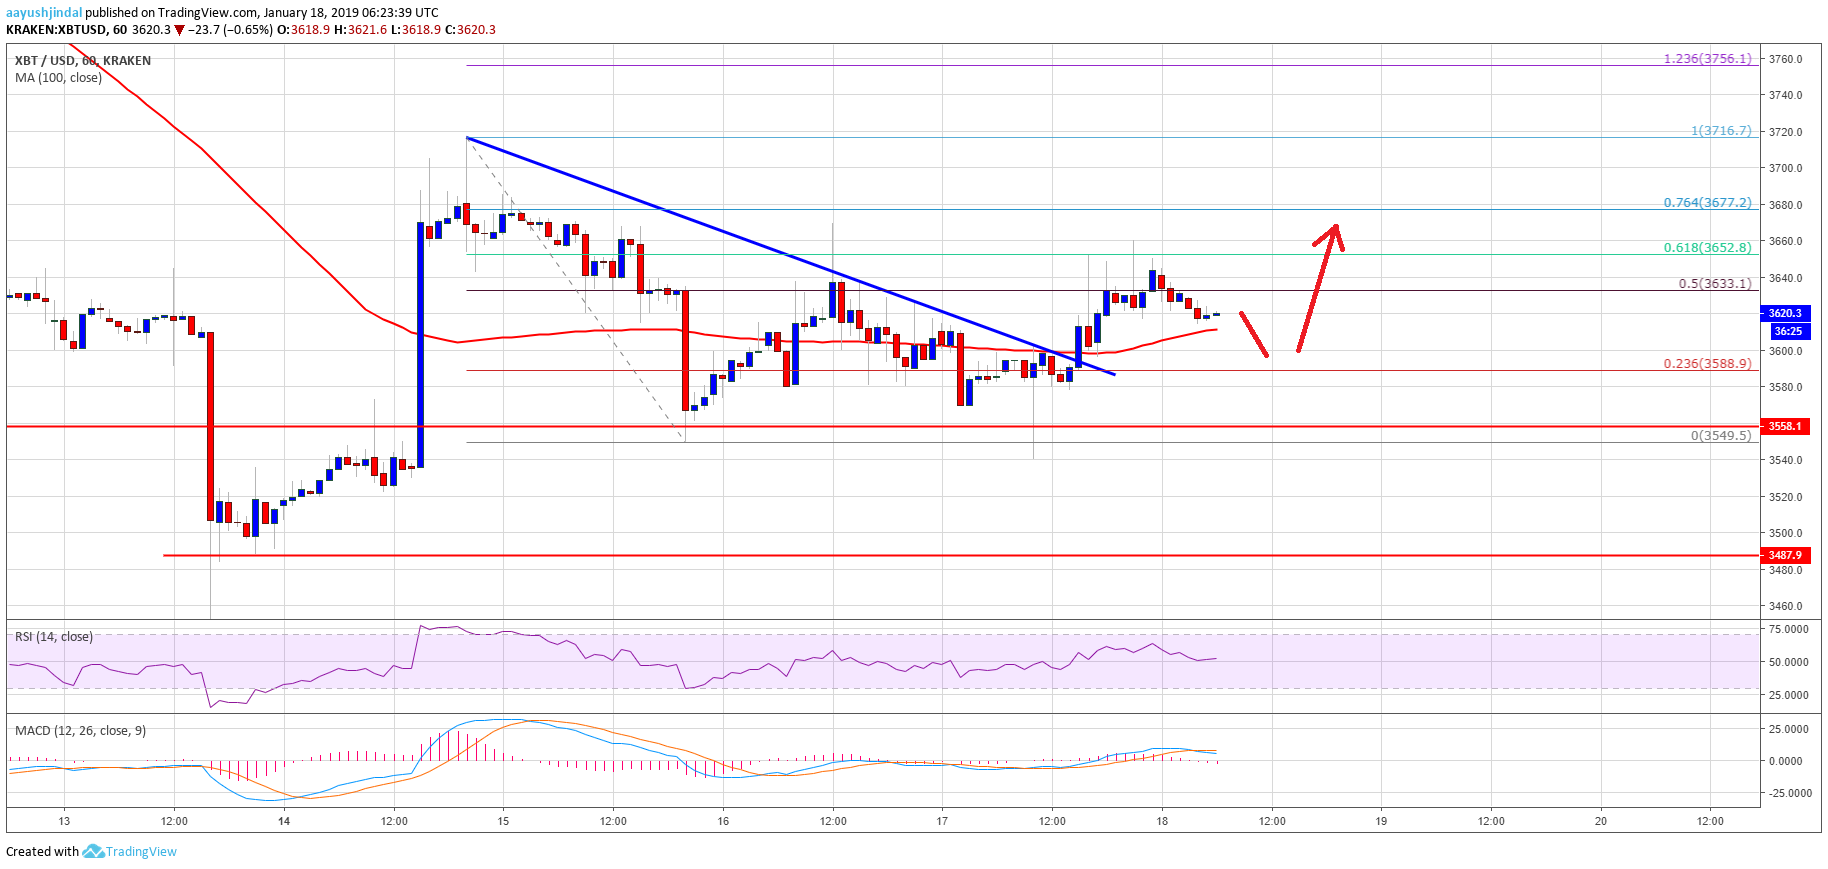
Looking at the chart, bitcoin price clearly made a nice upward move above the $3,600 level. Having said that, a beak above $3,660 is must for more gains. If not, there is a risk of a fresh drop towards the $3,550 and $3,540 support levels.
Technical indicators
Hourly MACD – The MACD for BTC/USD is slowly moving in the bearish zone.
Hourly RSI (Relative Strength Index) – The RSI for BTC/USD is holding the 50 level, with a positive angle.
Major Support Level – $3,550
Major Resistance Level – $3,660